The Serving Knobs That Mattered - and the Ones That Didn't
Part 3: Turning one vLLM flag at a time on a live endpoint, to separate the settings that move throughput from the settings that only look important
In Part 1, I fixed a concurrency-propagation bug and raised throughput about 22x. In Part 2, I compared six models on the same intent contract and found that serving speed had never been the quality problem.
Both parts left the same loose end. The endpoint was fast, but I could not say which serving settings were doing the work. The original fast configuration had turned on prefix caching, chunked prefill, a batch-size cap, and a context-window limit all in the same deploy. Bundled changes prove that a configuration works. They do not tell you which knob to reach for next time.
So this part answers a narrower, more useful question:
If you change exactly one vLLM serving flag and hold everything else constant, what actually happens to throughput and tail latency?
I ran five isolated experiments against a live Qwen 2.5 3B endpoint on a single L4. The result was a clean ranking:
Prefix caching was worth 3-4x throughput on this workload.
max_num_seqsset the batch ceiling.max_model_lenwas free headroom. Chunked prefill did nothing measurable here.
Three of those are load-bearing. One is a genuine null result. Reporting the null one honestly is part of the point.
The Method: One Knob Per Deploy, Production Untouched
The trap in serving benchmarks is changing two things and claiming one effect. To avoid it, every experiment changed exactly one flag from the production baseline.
Each variant config was pushed to the model's development deployment - a
separate, mutable slot on the same L4 instance type - using
baseten model push --develop. The production deployment was never touched. Each
variant was warmed, then swept across the same five concurrency levels (8, 12, 16,
24, 32 concurrent users) with the same temperature-0 workload and the same shared
enterprise prompt prefix.
| Item | Value |
|---|---|
| Model | Qwen 2.5 3B Instruct |
| Engine | vLLM 0.12.0 |
| Hardware | 1x L4, single replica |
| Baseline flags | --max-model-len 4096 --max-num-seqs 128 --enable-prefix-caching --enable-chunked-prefill |
| Sweep | 8/12/16/24/32 users, 60-80 requests per level |
| Admission | Baseten predict_concurrency 32 |
Because each dev deployment was config-identical to production except for the one
changed flag, each run is a fair one-knob comparison against the same baseline
curve. This closes the honest gap from Part 1: previously only predict_concurrency
had a clean before/after; now every batching flag does.
First, Where the Latency Actually Goes
Before turning knobs, it helps to know what a single request is spending its time on. Two no-deploy measurements settled that.
Decode dominates. Splitting end-to-end latency from the engine's own histograms, across 20 sequential requests:
| Component | Mean per request |
|---|---|
| Time to first token | 35 ms (1%) |
| Prefill | 32 ms |
| Queue | 0 ms |
| Decode | 3057 ms (99%) |
The ~3.7k-token enterprise prompt is almost free to process, because it is a shared prefix and the prefix cache serves it. Ninety-nine percent of the time is decode - generating the ~113-token intent JSON one token at a time.
That makes output length the latency lever. An A/B of pretty-printed versus compact JSON, sent back to back so the cached prefix stayed byte-identical:
| Output format | p50 latency | Output tokens |
|---|---|---|
| Pretty (default) | 3243 ms | 116 |
| Compact (when honored) | 2197 ms | 77 |
When the model honored the compact instruction, it was about 32% faster - purely from generating fewer tokens. But the prompt instruction was unreliable: the model honored it 7 times out of 12, ignored it 4 times, and once produced more tokens. The lesson is not "ask for compact JSON." It is "enforce compact output at the structured-output grammar layer, where it is deterministic, not in the prompt, where it is a suggestion."
Both findings point the same way: on this workload the endpoint is decode-bound and compute-bound, not memory-bound or prefill-bound. The knob experiments confirm it.
The Compute-Bound Knee
Under sustained 24-way load, scraping the server's own GPU and cache metrics:
| Metric | Idle | Under load |
|---|---|---|
| GPU compute utilization | (noisy) | ~0.56 -> 0.80 |
| KV cache usage | 0.9% | ~1.4% |
| Requests running | 1 | 24 |
| Requests waiting | 0 | 0 |
| Prefix-cache hit rate | - | 99.6% |
The KV cache pool sat near 1.4% full while GPU compute climbed and no requests queued. The single-replica knee is therefore compute-bound, not memory-bound. The GPU's math units saturate long before the KV cache runs out of room. That single fact predicts two of the four knob results before I ran them.
(One honesty note: the "idle" GPU number was noisy because the scrape caught an in-flight request. The load-bearing signal is the relationship under load - low KV, high compute, zero queue - not the idle point.)
The Four Isolated Knobs
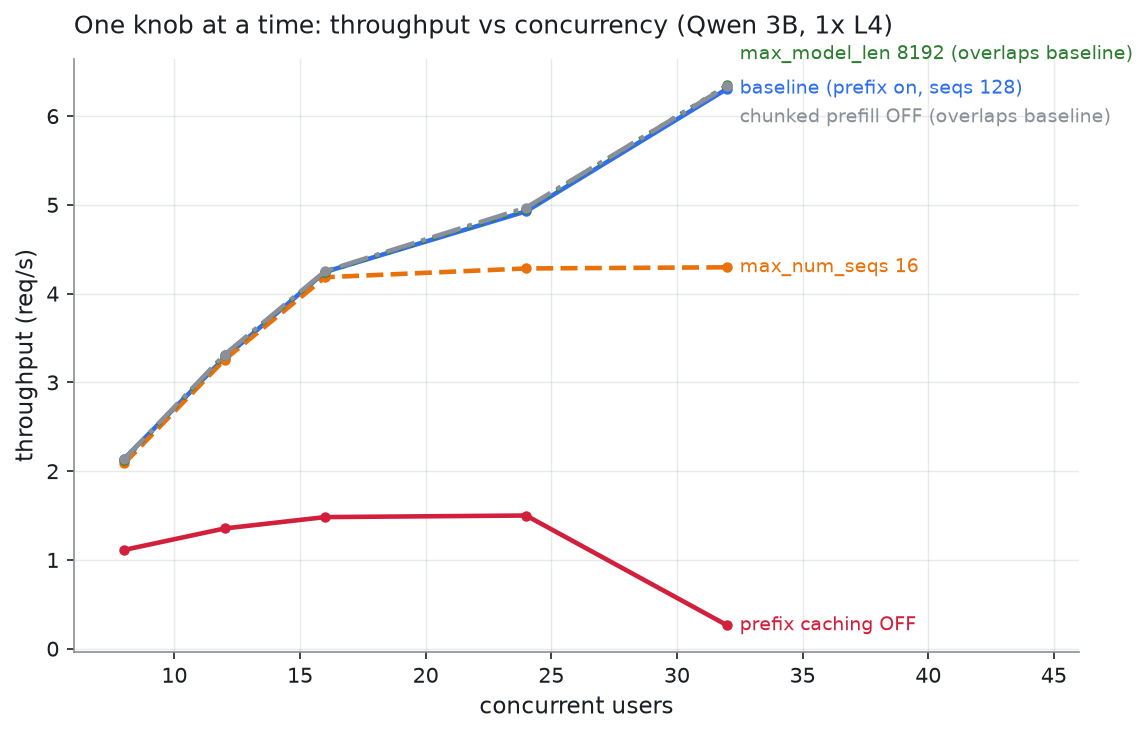
| Knob (one changed vs baseline) | 8u | 16u | 24u | 32u | p95 at 32u |
|---|---|---|---|---|---|
| baseline | 2.14 | 4.24 | 4.93 | 6.31 | 4.5 s |
max_model_len 8192 |
2.12 | 4.24 | 4.95 | 6.34 | 4.5 s |
max_num_seqs 16 |
2.09 | 4.18 | 4.28 | 4.30 | 7.5 s |
prefix_caching off |
1.11 | 1.48 | 1.50 | 0.26 | 32.1 s |
chunked_prefill off |
2.13 | 4.25 | 4.97 | 6.34 | 4.5 s |
Throughput in req/s. The full per-level tables, including p50/p95 at every concurrency, are in the companion project.
Prefix caching was the load-bearing knob
This is the A/B that had never been run. Turning prefix caching off dropped throughput 3-4x and inflated p95 by 5-7x, collapsing to 0.26 req/s at 32 users - with the only request failure of the entire study.
The reason is the workload's shape. The enterprise prompt is a large, shared prefix. With caching on, that prefill is computed once and reused, which is exactly why decode dominates and prefill is ~1% of latency. With caching off, every request re-prefills the whole prompt, and prefill contention crushes the endpoint under concurrency.
The takeaway generalizes: prefix caching is not an incidental optimization for a system with a long shared prompt. It is the thing that makes a long shared prompt affordable at all. If your architecture puts schema, glossary, and policy in a shared prefix - as this one deliberately does - prefix caching is load-bearing infrastructure, not a nice-to-have.
max_num_seqs set the batch ceiling
Capping the running batch at 16 while admission still allowed 32 concurrent requests plateaued throughput at ~4.3 req/s beyond 16 users, and roughly doubled p95 (4.5 s to 7.5 s). The extra requests could not join the batch, so they queued.
max_num_seqs is the size of the running batch, and the concurrency knee lands
exactly at its value. The baseline's cap of 128 was never the binding constraint -
admission (predict_concurrency 32) was - which is why the baseline kept scaling to
6.3 req/s. The lesson is to keep max_num_seqs at or above your admission target,
or you have quietly moved the knee left.
max_model_len 4096 to 8192 was free
Doubling the context window produced an identical throughput and latency curve. On this L4, with KV usage near 1.4%, there was enormous headroom, so a larger per-sequence KV footprint cost nothing at these batch sizes.
This is the practical payoff of the compute-bound finding. Context-window sizing here is capacity planning, not a performance dial: size it for the prompt you actually send plus real headroom for growth and longer valid outputs, and stop worrying that a bigger window is secretly costing throughput. It is not - until KV becomes the binding constraint, which on this deployment it is nowhere near.
Chunked prefill did nothing measurable - and that is a result
Turning chunked prefill off produced the same curve as baseline. That is a null result, and it is worth stating plainly rather than quietly dropping.
Chunked prefill earns its keep by interleaving long prefills with other requests' decode, so a big prompt does not stall the batch. On this workload there is nothing to interleave: prefill is tiny (prefix-cached) and outputs are short. The flag is correct to leave on as insurance, but on this traffic shape it is not what makes the endpoint fast. It would start to matter with long unique prefills competing against decode - a different workload than this one.
What This Says About Production Architecture
The measured knobs turn the roadmap's open design questions into defaults with evidence behind them.
Context sizing is capacity planning. Size max_model_len from the observed
input plus output length plus headroom, not from a desire to maximize it. Raise it
with a before/after sweep, and watch KV usage, the batch knee, and tail latency -
not just whether it boots.
There is no universal best concurrency. The same endpoint supports different valid operating policies, and the right one depends on what you are optimizing:
| Mode | Optimize for | Behavior on this endpoint |
|---|---|---|
| latency-first | p95 below target | operate near the knee (~16 users) |
| cost-first | lowest cost per query | push toward the ~32-user plateau, accept higher p95 |
| throughput-first | maximum completed work | run at the plateau and add replicas before p95 collapses |
| quality-first | semantic pass rate | route hard questions to a stronger model or a clarifier |
The open frontier is multi-replica. Everything here is single-replica, so it isolates engine behavior, not routing. The next questions are genuinely harder and deliberately out of scope for this measurement: round-robin routing can create hot workers when requests differ in token cost; routing for load balance can destroy the prefix-cache reuse that this article just showed is worth 3-4x; and autoscaling has to react to SLO pressure before a ~2-minute cold start has already broken the SLO. Those are design problems that a single replica cannot answer, and I would rather name them than pretend one L4 settled them.
Caveats
- Single replica, single L4, one model. These are engine-behavior results, not a routing or autoscaling study.
- The workload has a large shared prefix and short outputs. The prefix-caching and chunked-prefill results are specific to that shape; a long-unique-prefix workload would rank chunked prefill very differently.
- Latency is client-observed (network + client queue + server queue + inference). The TTFT/decode split uses the server's own histograms and is labeled as such.
- Sweep levels use 60-80 requests each - dense enough to place the knee, thin enough that tail percentiles carry ordinary small-sample noise.
- The dev-slot comparison assumes the development and production deployments behave identically given identical config on the same instance type, which is the intended contract but not separately proven here.
Reproducibility
The companion project contains the sweep driver, the metrics scrapers, the config variants, and every raw sweep JSON:
results/runs/2026-07-24_a16_redeploy_knob_sweeps.md- the four isolated knobs.results/runs/2026-07-24_a16_no_redeploy_sweeps.md- the decode split, the compact-output A/B, and the GPU-under-load scrape.results/METRICS-AND-KNOBS.md- the full knob -> observable -> caution reference, now with a clean before/after for every batching flag.scripts/loadtest.py,scripts/ttft_decode_split.py,scripts/gpu_under_load.py,scripts/ab_json_format.py,scripts/plot_a16_knob_sweeps.py.
The one-line summary I would give a teammate: on a decode-bound endpoint with a long shared prompt, prefix caching is the knob that matters, batch size sets your ceiling, context length is free headroom until it isn't, and the interesting problems start at the second replica.